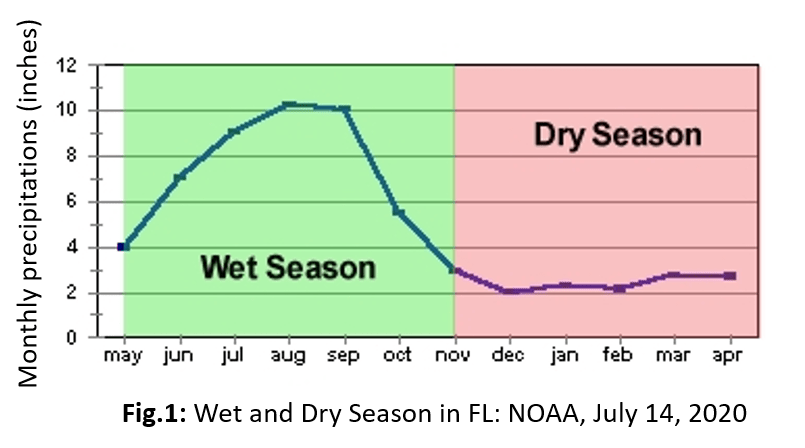
In Florida, more than 50% of annual rain falls within the months of June through September (Fig. 1), with an average of about 7 inches per month1. This is what we parochially call the wet season, the Florida rainy season, or the Florida monsoon. For the remaining eight months, rainfall drops to about 2 inches a month—the dry season. If you find yourself paddling the headwaters of many blackwater rivers during the dry season, prepare to portage. On those same rivers you’ll want to duck and cover in the wet season. There are more lightning strikes in Florida than any other state in the union (Fig. 2)2. The river you were on in December will look a lot different in August. Flood waters undercut levees and gobble up creeks, oxbows, bayous and backswamps, knock over trees and turn sweepers into strainers {Monsoons and Moonflowers}.
When I first arrived in Florida, I would often say that the climate is a bit like the U.S. Southwest. In New Mexico, 64% of annual rainfall comes late summer. This is referred to as the North American Monsoon1. Here, warm wet air flowing from the Gulf of Mexico and the Gulf of California drop their burden over the dry deserts of northern Mexico, west Texas, New Mexico and Arizona July through September.

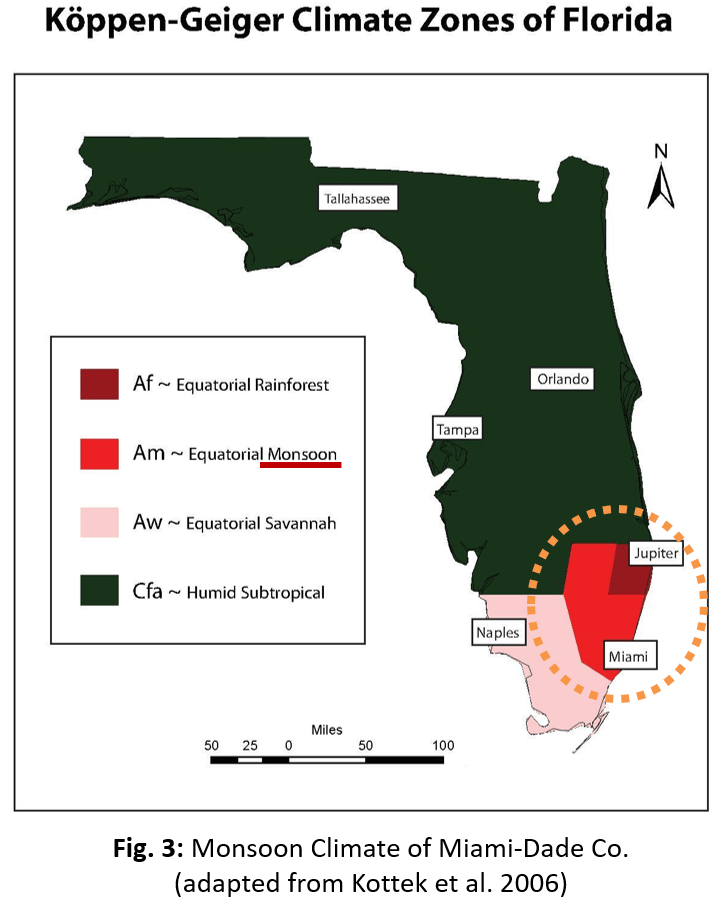
So, does Florida have a monsoon climate? Well, according to the Koppen climate classification system—mostly, no (Fig. 3)3,4. To qualify as a monsoon climate, average rainfall in the wettest month would have to exceed rainfall in the driest month by at least 10-fold5,6. That amounts to about twenty inches of rain—almost twice that observed for the Amazon7.
Whatever it should be called, it is wet and the rivers are wild. Peninsular Florida is once again invaded by the sun-warmed waters of the Gulf, Caribbean and subtropic Atlantic Seas that chase the fleeting Bermuda Ridge of a winter passed8. The barren sloughs, creeks and runnels of March are now encumbered with summer rain. And we explore.
Anchor Podcast: https://anchor.fm/james-riordan/episodes/Blackwater-Letters-and-The-Florida-Monsoon-em1qjm/a-a3opb04
BIBLIOGRAPHY
1. National Oceanic Atmospheric Administration (NOAA) Centers for Environmental Information (www.ncdc.noaa.gov/climate-information).
2. Florida Climate Center (FCC), Florida State University (www.climatecenter.fsu.edu). Retrieved in August 2020.
3. Beck, Zimmermann, McVicar et al. Data descriptor: present and future Koppen-Geiger climate classification maps at 1 km resolution. 2018. Nature. DOI| 10.1038/sdata.2018.214.
4. Kottek et al. World map of the Moppen-Geiger climate classification updated. 2006. Meteorologische Zeitschrift, 15(3).
5. Lascody. The onset of the wet and dry seasons in east central Florida-a subtropical wet-dry climate? 2002. NOAA National Weather Service (www.weather.gov).
6. Peel, Finlayson and McMahon. Updated world map of the Koppen-Geiger climate classification. 2007. Hydrol. Earth Syst. Sci. 11: 1633-1644.
7. World Meteorological Organization, WMO. (www.public.wmo.int/en). Retrieved in August 2020.
8. Misra, Bhardwaj and Mishra. Characterizing the rainy season of peninsular Florida. 2017. Climate Dynamics. DOI | 10.1007/s00382-017-4005-2.
If you enjoy what you read, please smash the like and share buttons below!
